Reading maritime news like an industry analyst means asking three questions of every story: who is the original source, what does the event change in physical terms, and what does it cost. Merriam-Webster defines the verb "read" as to interpret the meaning or significance of a text, and that is the right frame — according to Merriam-Webster, reading is interpretation, not absorption. A headline about a sunk bulk carrier is not news about a ship. It is news about a route, a rate, and an insurance premium.
The method has one core principle: every tariff, attack, or contract lands on something physical. A vessel is delayed, a cargo is rebooked, a premium is repriced. Analysts trace each event down to the pallet, the charter, and the invoice. Anyone can build the same habit. It requires no trading terminal, only discipline about sources and a short mental checklist applied to every story.
This guide sets out the source hierarchy analysts use, the indicators worth watching, and the common traps that turn news readers into news spreaders. The examples draw on the kind of coverage found in maritime news reporting, where events are dated and attributed to primary sources.
Which sources should you trust first?
Analysts rank sources by proximity to the event. The hierarchy runs from primary documents down to commentary. An official service statement, a port authority notice, a flag-state investigation report, or an insurer's circular sits at the top. A wire story summarizing that document sits below it. An opinion column reacting to the wire story sits at the bottom.
The practical rule: never form a view on a story you have only seen secondhand. If a report says a navy released findings on an incident, find the findings themselves. If a piece describes a budget line for new vessels, look for the budget document. Primary sources are slower to read and often duller. They are also the only sources that let you check whether the summary got the numbers right. We covered a connected angle in The Navy's FY2026 Budget Put Unmanned Surface Vessels in the Shipbuilding Line.
A second rule concerns attribution. A shipbuilder is the authoritative source for its own delivery schedule, but not for independent verification of it. A navy is the source for its own fleet counts. Analysts note the source of every figure and treat self-reported claims as claims, not facts. This single habit separates professional reading from casual scrolling more than any other.
What indicators do professionals actually watch?
News tells you what happened. Indicators tell you whether it matters. Analysts watch a small set of recurring measures, and most are qualitative until you have access to paid data.
- Route disruption. When attacks or closures force ships away from a passage, the story is not the attack itself but the added days and fuel. A longer route means higher cost per delivered unit, and the cost lands on cargo owners before it lands on consumers.
- Insurance and war-risk pricing. Insurers reprice risk faster than governments issue statements. Rising premiums on a route are often the earliest reliable signal that underwriters see a sustained threat, not a one-off event.
- Charter rates and tonnage supply. If vessels are tied up escorting, rerouting, or waiting, effective supply shrinks and rates move. Analysts read rate movements as the market's own summary of the news.
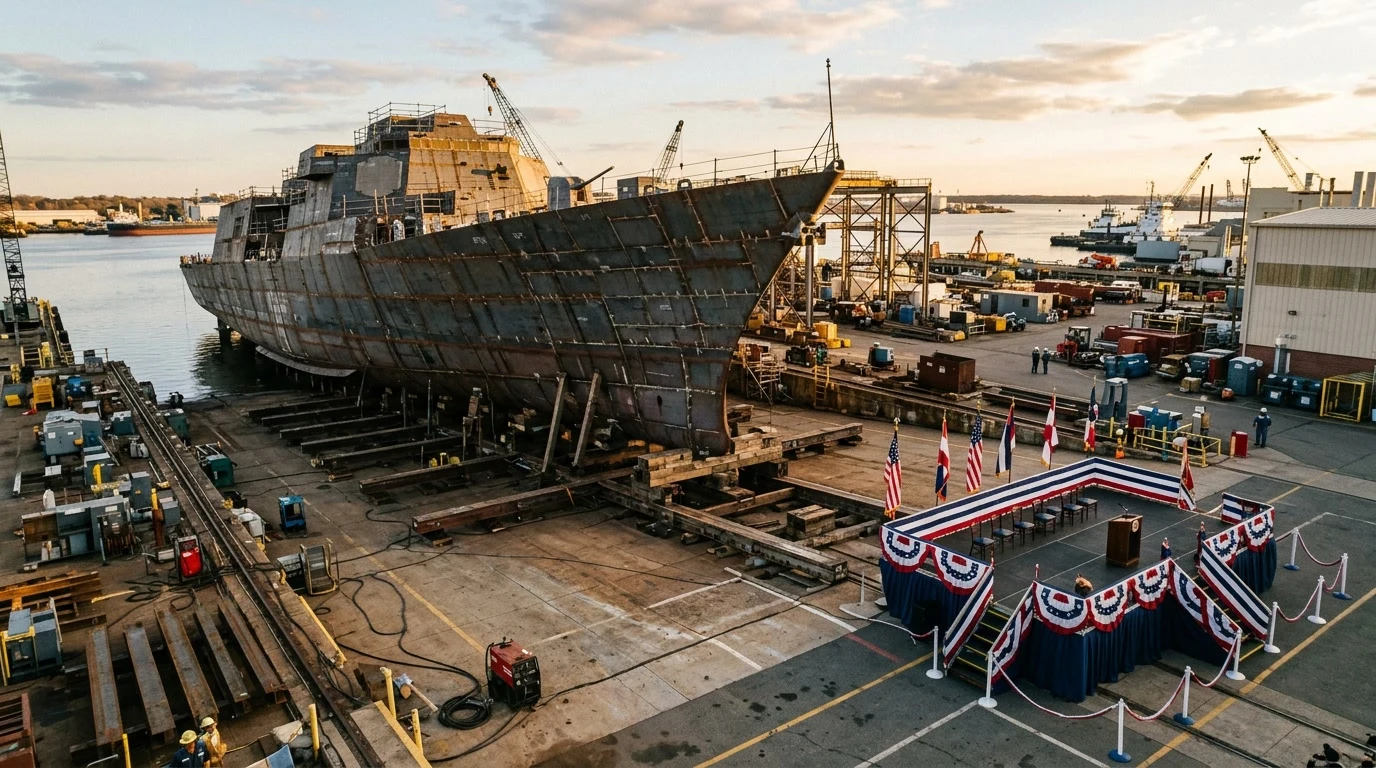
- Program and budget signals. Contract awards, budget lines, and shipbuilding milestones reveal capability years before a ship takes water. A budget line for unmanned vessels, for example, tells you more about future fleet shape than any launch ceremony.
None of these require a subscription to start. Reading a story and asking "what did this do to days, dollars, or deterrence?" gets most of the way. The analyst's edge is consistency: applying the question to every story, including the boring ones.
How do you separate signal from noise?
Maritime news is full of events that sound large and change little. Analysts use three filters.
First, check the geography against trade flows. An incident in a minor passage matters less than the same incident on a route that carries a large share of a commodity. The question is not "how dramatic?" but "how much cargo normally passes here?"
Second, check duration. A two-day closure is an operational event. A pattern of attacks over months is a structural one, and structural events reprice routes, insurance, and ship values. Coverage of sustained campaign-style threats, such as the escort operations and repeated attacks reported in the Red Sea through 2025, deserves a different weight than a single isolated incident. For related coverage, see Houthi Attacks Sank Two Bulk Carriers in the Southern Red Sea in July 2025.
Third, check the counterparty. Who bears the cost? A delay borne by a charterer under a laycan clause differs from one borne by an owner under a hire agreement. Analysts with a chartering background read every disruption as a contract question: which party's pocket does this land in? That framing turns a dramatic story into an accounting one, which is where the real analysis begins.
What does this mean for the regular reader?
Our analysis, in plain terms: the skill is not access to better data. It is a repeatable routine. For any maritime story, an analyst does the following.
- Identify the primary source behind the report and, where possible, read it.
- Date the information. Fleet facts, threat levels, and premium levels all age quickly, and an undated number is close to worthless.
- Translate the event into physical and financial terms: days added, cargo affected, cost shifted, and to whom.
- Place the event in a series. Is this the first instance or the twelfth? Trends, not events, move markets and policy.
- Note what is unknown. A good analyst states the limits of the evidence as clearly as the findings.
Readers who want to go deeper on specific beats can follow the site's coverage areas directly: fleet developments, policy and budget coverage, and shipbuilding programs each reward a different set of indicators. Process explainers, such as how ships move from order to commissioning, show how program news maps onto delivery timelines.
Where does analyst reading most often go wrong?
Three failure modes recur. The first is recency bias: treating the latest incident as the start of a trend when it is the middle of one, or vice versa. The second is source drift: a claim enters circulation attributed to an official, then gets repeated until the attribution drops away. Tracing a claim back to its origin document cures this.
The third is mistaking activity for effect. A large naval deployment is an input, not an outcome. The outcome questions are the analyst's questions: did attacks stop, did premiums fall, did traffic return? Coverage that reports the deployment without the effect measures tells you what happened, not what it meant. The strongest counter-argument to heavy indicator-watching is that markets sometimes move on narrative alone, ahead of any physical change. That is true. But over any horizon longer than a news cycle, the physical numbers — days, tonnage, premiums — are what the narrative has to answer to. The numbers do not always support the story, and checking them is the whole job.